
How to read candlestick patterns
Candlestick charts provide detailed visual insights into how an asset’s price changes over time, helping users quickly understand market sentiment.
Candlestick charts are one of the most informative ways to understand how token prices move. They visualize the flow of buying and selling, showing not only where a token pair’s price stands but also how it reacts to market sentiment over time.
Learning to read candlestick patterns helps interpret what is happening with a token’s price, whether it is rising, falling or consolidating, and provides a deeper sense of the market’s rhythm.
What candlesticks represent
Each candlestick shows how a token’s price behaved within a specific time frame, such as 15 minutes, 1 hour, 1 day, 1 week or over a wider range. Shorter time frames capture quick fluctuations, while broader ones reveal how a token’s price evolves over the long term.
Every candle includes:
- Open: the price at the start of the period
- Close: the price at the end of the period
- High: the highest point reached
- Low: the lowest point reached
The body represents the range between the opening and closing prices, while the thin wicks (or shadows) show the highs and lows.
A green candle means the token closed higher than it opened, indicating upward movement.A red candle means it closed lower, showing downward movement. Together, these candles form a continuous visual record of how a token pair’s price evolves over time.
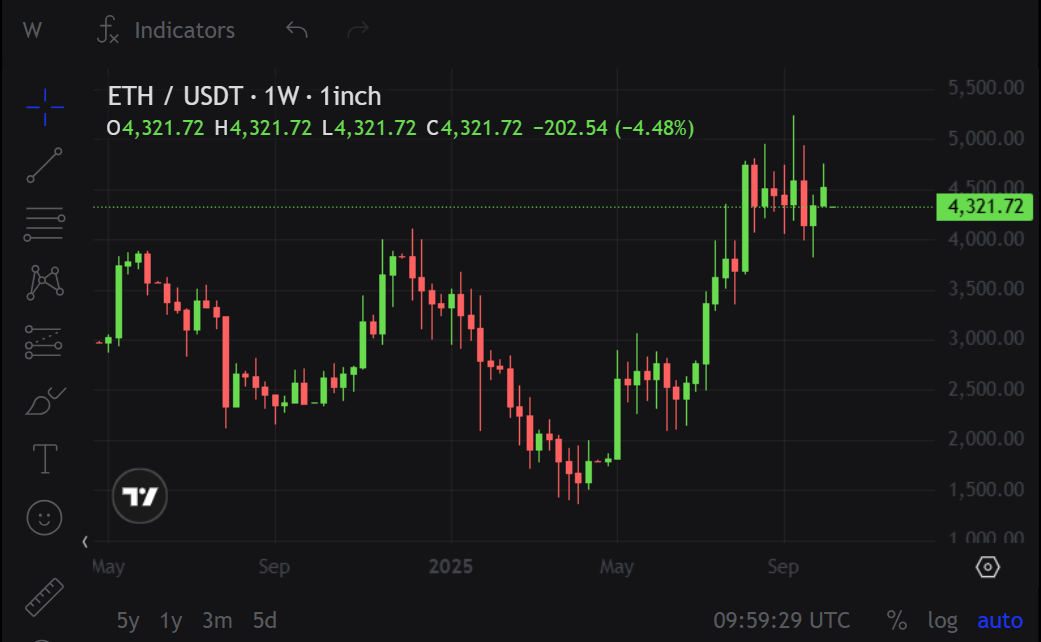
Example of how candlestick charts appear in 1inch Pro, showing weekly ETH/USDT price movements.
Recognizing candlestick patterns
Candlesticks can form recognizable shapes called patterns, which hint at possible market behavior:
- Doji: almost equal open and close, signaling indecision
- Hammer: small body and long lower wick, showing a potential rebound after a drop
- Shooting star: long upper wick, possibly indicating a weakening rally
- Engulfing pattern: one large candle fully covers the previous one, often suggesting a reversal
These structures reflect how traders react to price changes, showing shifts in confidence or momentum within a token pair.
Why reading candlestick patterns matters
Candlestick charts help interpret:
- Price direction: whether the token is gaining or losing value
- Market sentiment: how strongly buyers or sellers dominate
- Volatility: how stable or erratic the price movement is
- Potential reversals: moments when trends might start changing
In DeFi markets, where prices update continuously, these patterns make it easier to understand what is happening with a token’s price at a glance.
Indicators: the next layer of insight
Charting platforms integrated into DeFi dashboards, such as TradingView in 1inch Pro, include indicators that analyze price data automatically.
There are multiple indicators, each focusing on a specific aspect of price behavior, such as trend direction, momentum or volume flow.
Some commonly used examples include:
- Moving Averages (MA / EMA): smooth out noise to show the general trend
- Bollinger Bands: display volatility ranges, showing when prices tighten or expand
- Relative Strength Index (RSI): measures price momentum and indicates whether an asset may be overbought or oversold
RSI is just one example of a momentum indicator, not a universal measure. Different indicators serve different purposes, and their usefulness depends on the token pair and time frame.
How to choose and use indicators
Since there are so many indicators available, the key is knowing what to look for:
- Define the goal: determine whether you want to see the overall trend, check volatility or measure buying and selling pressure
- Select by type:
- For trend tracking, use Moving Averages or Aroon
- For momentum, try RSI or MACD
- For volatility, use Bollinger Bands or Average True Range (ATR)
- For volume strength, use On-Balance Volume (OBV) or Accumulation/Distribution
- Avoid overload: two or three indicators at a time are enough, as combining too many makes interpretation unclear
Indicators are best used to confirm what candlestick patterns already suggest rather than replace them.
Other charting tools that support candle reading
- Trend lines and horizontal levels: mark areas of support and resistance
- Fibonacci retracements: estimate potential pullbacks or extensions in price
- Projection tools: simulate long or short positions to visualize possible price targets
- Volume profiles: show price levels with the most activity, highlighting key zones of interest
These tools help interpret not only the movement of a single candle but also the broader context of how a token’s price interacts with historical levels and trading activity.
How everything connects
Candlestick patterns form the foundation, while indicators and tools add depth.
- A hammer candle may suggest a rebound, confirmed by a momentum indicator turning positive.
- A series of green candles could signal an uptrend, supported by a rising moving average.
- Fibonacci levels may align with candle wicks, showing areas where traders previously reacted.
Each layer of analysis builds on the next, giving a complete picture of what is happening with a token’s price.
Candlestick charts translate complex price data into a clear visual story of how a token pair’s price opens, moves and closes within each period. Indicators, Fibonacci tools and trend lines enhance that story by providing measurable insights into momentum, volatility and liquidity.
Together, they allow anyone analyzing a DeFi market to move from simply seeing price changes to understanding the forces behind them, making candlestick reading one of the most essential skills in crypto analysis.
Stay tuned for more insights from 1inch as we explore the latest trends in DeFi!
Share the article


Recent Posts
Stay safe in DeFi with 1inch
DeFi opens the door to sending value without barriers, reaching global markets and taking full control of your assets. But none of that works without adequate security.
How one Zoom update drained millions in crypto
It was all routine. A media outlet wanted an interview with David, an experienced software developer and crypto miner. He’d already met the interviewer at a conference, so he knew it was legit. A Zoom was scheduled.

DeFi security: How to stay safe and avoid crypto scams in 2026
Every day, millions of users trust DeFi to move value freely, access global markets and stay in control of their assets. That trust matters to us. Your security isn’t a feature. It’s the foundation of everything we build.